
Guernsey House Prices vs Wages: 50 Years of Moving Goalposts
Fifty years of Guernsey house prices and earnings reveal a striking change in affordability. An average property cost around five years of gross earnings in 1976. Today, the equivalent figure is approximately fourteen.
Published 15 Oct 2026, 05:00 BST · Last edited 15 Oct 2026, 05:00 BSTShare this page ↗
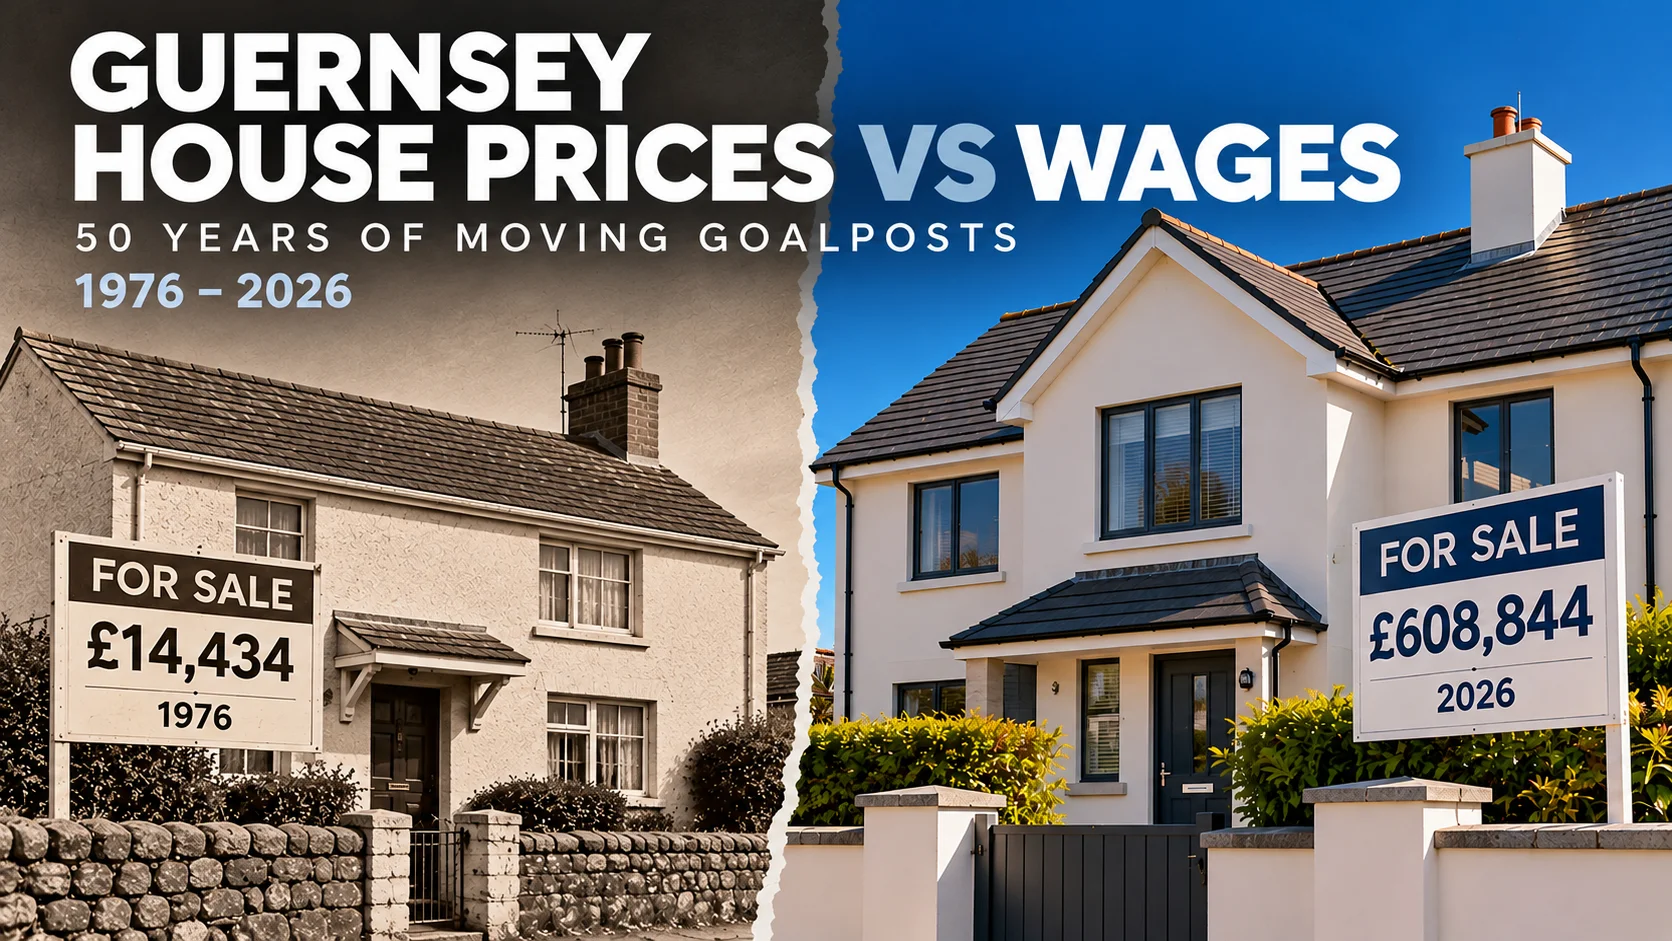
The price of a home. The cost of a generation.
There was a time when buying a home in Guernsey was an achievable ambition for many ordinary working islanders. It wasn't necessarily easy, mortgages weren't always cheap, and saving for a deposit still required sacrifices.
But something fundamental has changed.
Over the past 50 years, property prices have risen dramatically. Wages have increased too, of course, but the interesting question isn't simply how much houses cost today compared with yesterday. It's how much of our working lives those houses represent.
In 1976, the average property price in Guernsey is estimated to have been just £14,434. By the second quarter of 2026, the mix-adjusted average Local Market property price had reached £608,844.
That's an increase of approximately 42 times in just 50 years.
But here's the real question: Have wages increased by anything like the same amount?
To explore that question, I've compared historical Guernsey property prices with annual gross earnings at five-year intervals, covering 1976 to 2026. The results tell an interesting and rather uncomfortable story.
Why compare house prices with earnings?
Looking at property prices alone tells us surprisingly little about affordability. A £30,000 home sounds extraordinarily cheap today. But if you're earning £5,000 a year, it suddenly looks rather different.
That's why economists often use something called the house-price-to-earnings ratio.
Average property price ÷ annual gross earnings = price-to-earnings ratio.
A £300,000 house against a £30,000 salary produces a ratio of 10. In other words, the property costs ten years' gross earnings, before tax, interest, food, electricity or any of life's other inconvenient necessities.
And no, I'm not suggesting someone could save their entire salary for ten years. Apparently, eating and having somewhere to live are still considered essentials.
The comparison below uses one person's median gross earnings (the midpoint of the earnings distribution), not two earners' combined income. Guernsey's published median figures include full and part-time employees, so this is not a full-time salary comparison. It focuses on the Local Market, not Guernsey's higher-priced Open Market. Older price measures also differ from today's mix-adjusted method.
Fifty years of property prices and earnings
The table combines published Guernsey property observations, published earnings from 2006 onwards, and transparently labelled historical reconstructions. The 1976 and 1986 property prices are estimates; earnings before 2006 are backcast from a UK wage trend, not observed Guernsey salaries.
If you're viewing this on a mobile device, you may need to swipe left to see the full table.
| Year | Average property price | Annual gross earnings | Price / earnings |
|---|---|---|---|
| 1976* | £14,434 | £2,865* | 5.0× |
| 1981 | £28,135 | £5,574* | 5.0× |
| 1986* | £51,656 | £8,242* | 6.3× |
| 1991 | £94,841 | £12,705* | 7.5× |
| 1996 | £101,977 | £15,685* | 6.5× |
| 2001 | £210,000 | £20,067* | 10.5× |
| 2006 | £311,000 | £23,660 | 13.1× |
| 2011 | £427,226 | £28,340 | 15.1× |
| 2016 | £435,000 | £31,656 | 13.7× |
| 2021 | £505,579 | £36,732 | 13.8× |
| 2026† | £608,844 | £42,672† | 14.3× |
* Modelled: Guernsey property price for 1976 and 1986, and pre-2006 median-earnings estimates. These are indicative, not original local statistical observations. † 2026: Q2 2026 property price is compared with the latest previously established published earnings benchmark, June 2024 (£42,672). It is not a 2026 wage figure. Earlier prices mix annual historical index figures and selected reported quarters. This methodology has changed.
When did the gap widen?
The first striking comparison is between 1981 and now. In 1981, the £28,135 average property represented approximately 5.0 times the modelled annual earnings benchmark of £5,574. At Q2 2026 prices, using the June 2024 median earnings figure, the comparable indicative multiple is 14.3 times.
To put the long-term change another way, house prices increased about 21.6-fold between 1981 and Q2 2026. The earnings benchmark rose about 7.7-fold between 1981 and June 2024. These are not perfectly matched dates, but the difference in scale is hard to ignore.
It's equally important to avoid claiming that the ratio has gone up every single year. The comparison reaches approximately 15.1 times in the selected 2011 figures, for example, slightly above the 2026-price/2024-wage calculation. A 2024 Guernsey housing review, using a more internally consistent rolling comparison, recorded 14.8 in 2011, 12.8 in 2019 and 14.5 in 2024. Different methods produce slightly different results, but they agree on one thing. The cost of buying relative to earnings has remained very high for a long time.
The affordability gap, illustrated
Guernsey house prices versus annual gross earnings, 1976–2026. Historical estimates and data limitations are explained in the article.
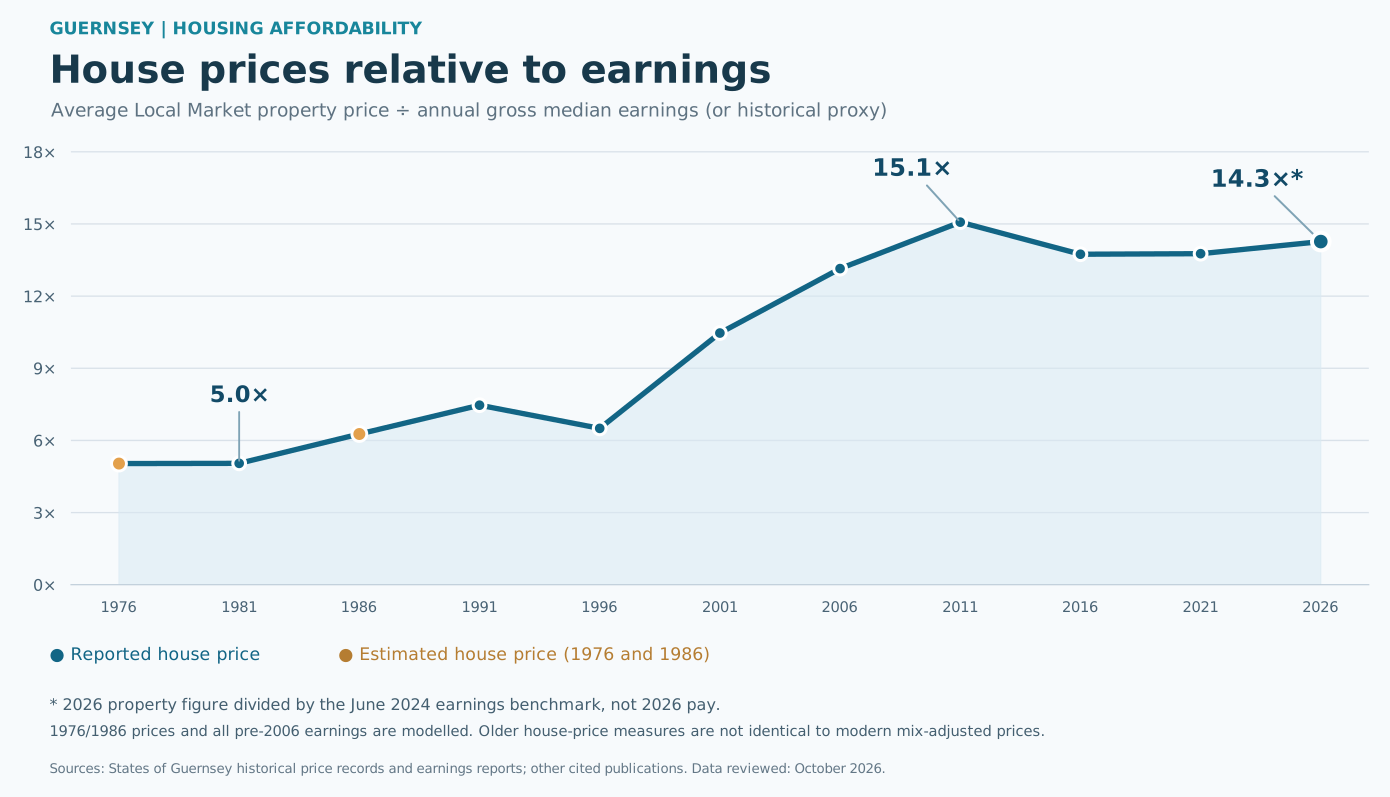
Chart: Average Guernsey Local Market property price as a multiple of annual gross median earnings or historical earnings estimates. The 2026 comparison uses the June 2024 earnings benchmark.
There is something particularly revealing about this graph.
Although house prices have continued to increase, the affordability ratio hasn't followed a perfectly straight upward trajectory.
The comparison peaks around 2011, then improves slightly before rising again.
Indeed, a separate Guernsey housing review, using a more consistent modern methodology, recorded a price-to-earnings ratio of 14.8 in 2011, 12.8 in 2019, and 14.5 in 2024.
That broadly supports the picture shown here. Affordability has fluctuated, but homes have remained exceptionally expensive relative to earnings for many years. [The Guernsey Housing Plan]
And then there's the deposit
A house-price multiple is rather abstract until you imagine trying to save the deposit. Take a simple 10% deposit:
- 1981: A £28,135 home required around £2,814 upfront, or roughly 50% of our modelled annual gross earnings benchmark.
- 2026: A £608,844 home requires around £60,884 upfront, or roughly 143% of the June 2024 gross median earnings benchmark.
That's the difference between around six months of gross pay and roughly seventeen months of gross pay. Neither figure allows for tax or ordinary living costs, so neither tells you how long somebody would actually need to save.
And these are deposits on an average Local Market property, not the cheapest first-time buyer flat. Smaller homes, shared incomes, family support and mortgage products can change an individual's experience considerably.
What the numbers don't tell us
There are a few fair challenges to this comparison. Mortgage interest rates in the 1970s and 1980s could be punishing. Modern buyers may have two incomes rather than one. Property sizes, quality and the types being sold have changed, while lending rules, taxes and deposits also matter.
There is also a statistical limitation worth being open about. Guernsey's older property averages were calculated differently from the modern mix-adjusted series, which accounts for the mix of homes changing hands. And the published median earnings figures cover full and part-time employees rather than measuring a typical full-time mortgage applicant's salary.
Most importantly, the States' latest earnings series has been delayed. The £42,672 used against 2026 house prices relates to June 2024, not October 2026. Once updated Guernsey earnings become available, that final multiple should be recalculated.
For these reasons, the table and chart should be read as an indicative 50-year reconstruction, not an uninterrupted official index or a mortgage affordability assessment. The precise multiple for an individual household will depend on its circumstances.
Is the grass greener across the water?
Perhaps one of the most revealing comparisons is what happens when we look beyond Guernsey's shores.
According to the Office for National Statistics, the average house-price-to-earnings ratio in England was 7.6 in 2025, while Wales stood at 6.0.
Even London, notorious for its eye-watering property prices, recorded an average ratio of 10.6. In North East England, the figure was just 5.0.
Meanwhile, Guernsey's indicative ratio stands at approximately 14.3, using 2026 property prices and the latest available earnings figures from 2024.
Of course, these aren't perfectly like-for-like comparisons, and some parts of London are considerably more expensive than Guernsey. But the overall difference is difficult to ignore.
For younger islanders and families hoping to establish themselves, these figures raise an uncomfortable question.
Why struggle to afford a home in Guernsey when the same earnings might provide considerably greater opportunities elsewhere?
Moving away isn't necessarily an easy decision. Guernsey is home, with family, friends, careers and generations of personal history. But there's only so much sentimental attachment can do when faced with the practicalities of paying a mortgage, raising children and building a financially secure future.
And perhaps that's the real danger. If we cannot make homeownership reasonably achievable for the next generation, we shouldn't be surprised when some start looking towards the next boat.
Not because they don't love Guernsey, but because they can no longer afford to build their future here.
What does this mean for Guernsey?
For homeowners who bought years ago, rising property values may have created substantial paper wealth. For younger islanders and people trying to buy their first home, those same price rises can look rather different.
When homes consume a larger share of potential earnings, the implications go beyond mortgages. It becomes harder for people to settle, start families, change jobs, or remain on the island where they grew up. Employers have to think about housing as part of recruitment. Families who can help with deposits gain an advantage over those who can't.
None of this proves that there is one simple cause, or one magic solution. Increasing supply, the availability of smaller homes, income growth, mortgage costs and wider housing policy all deserve serious attention.
But it does raise a question worth asking whenever we discuss Guernsey's future:
What does economic prosperity actually mean if the people working here increasingly struggle to afford somewhere to live?
We often hear that Guernsey needs to attract workers, retain young families and build a sustainable future. Housing cannot be treated as a separate conversation. It's part of the same question.
Because a home should be somewhere to build a life, not simply an asset that keeps getting further away from the people hoping to buy one.
Sources and research notes
The figures are compiled from the sources below. Pre-2006 earnings are reconstructed using UK historical wage growth, and the 1976/1986 property prices are modelled. For a rigorous time-series study, the ideal next step would be to recover Guernsey's original annual house-price table and earnings records for the early decades and harmonise the methodologies. Can you help fill in the gaps? If you know where I might find historical Guernsey house prices or wage statistics, particularly from the 1970s and 1980s, please do not hesitate to get in touch. I'd love to replace the estimates with actual figures wherever possible. After all, the more accurate the data, the harder it is to argue with the maths!
- States of Guernsey Hansard, 1 October 2021, p.1883 (historical index figures for 1981, 1991 and 2001)
- Mortgage Solutions, 24 October 2005 (Guernsey historical Local Market prices, including 1996)
- Government of Jersey House Price Index Q4 2006 (Guernsey price comparison and method change)
- PropertyWire, August 2011 (Guernsey Q2 mix-adjusted price)
- Government of Jersey, House Price Index Q2 2016 (Guernsey Q2 price)
- ITV Channel, August 2021 (Guernsey Q2 price)
- Guernsey Press, August 2026 (Q2 2026 Local Market price)
- States of Guernsey, Billet d’État III 2015 (historical Guernsey median earnings)
- States of Guernsey, P.2022/57 (2021 median earnings)
- States of Guernsey, P.2024/59 (median includes full and part-time employees)
- Guernsey housing market review, 2024 (comparable affordability ratios, 2011–2024)
- Bailiwick Express, December 2025 (earnings statistics delays)
- Bailiwick Express, January 2026 (£42,672 Guernsey median earnings reference)
- UK historical earnings benchmark, House of Commons written answer 2004
- Nationwide historical UK property price comparator (UK backcast assumption)
- ONS Housing Affordability in England and Wales, 2025.